By Avni YayinUpdated
Speed from height
A coaster trades height for speed. At the top of the lift hill the train has potential energy (its mass × g × height); at the bottom that energy has become motion. With nothing lost, the speed at the bottom is v = √(2 g h), whatever the train weighs. A 60 m drop gives about 34.3 m/s: 124 km/h or 77 mph.
Real trains lose some of that energy to wheel friction and air resistance, so they arrive a little slower. The “energy lost” box takes a share off: 10% lost gives √0.9 of the ideal speed, about 5% slower.
G-force in a valley
At the bottom of a dip the track bends upwards and has to push the riders round the curve as well as hold them up. What they feel is 1 + v² / (g r) times their weight, where r is the radius of the curve. Faster, or a tighter curve, means more g.
That’s why big coasters pull out of their drops in long, sweeping curves: at 34 m/s, a 30 m radius gives about 5 g; a 60 m radius gives about 3 g.
G-force in a loop
Going up a loop the train slows down: climbing two radii costs 4 g r of the speed squared. At the top, gravity already does part of the turning, so riders feel v² / (g r) − 1. At exactly 0 g they float; below 0 the restraint has to hold them in.
A perfect circle is a bad loop: fast enough at the top means far too many g at the bottom. That’s why modern loops are tall teardrops (clothoids), tight at the top and wide at the bottom. This calculator uses one radius, so it shows the circular worst case.
How much is too much?
Ride designers work to standards such as ASTM F2291, the design practice for amusement rides. It sets limits on each axis (up and down, side to side, front to back), counts gravity in (a rider sitting still feels 1 g), and allows less the longer an acceleration lasts: a peak of a fraction of a second may go well above what riders may feel for several seconds.
Downward-pulling (negative) g is tolerated far worse than being pressed into the seat, and quick reversals between the two are limited further. So a high g-number here is fine only if it’s brief.
In Park Baron
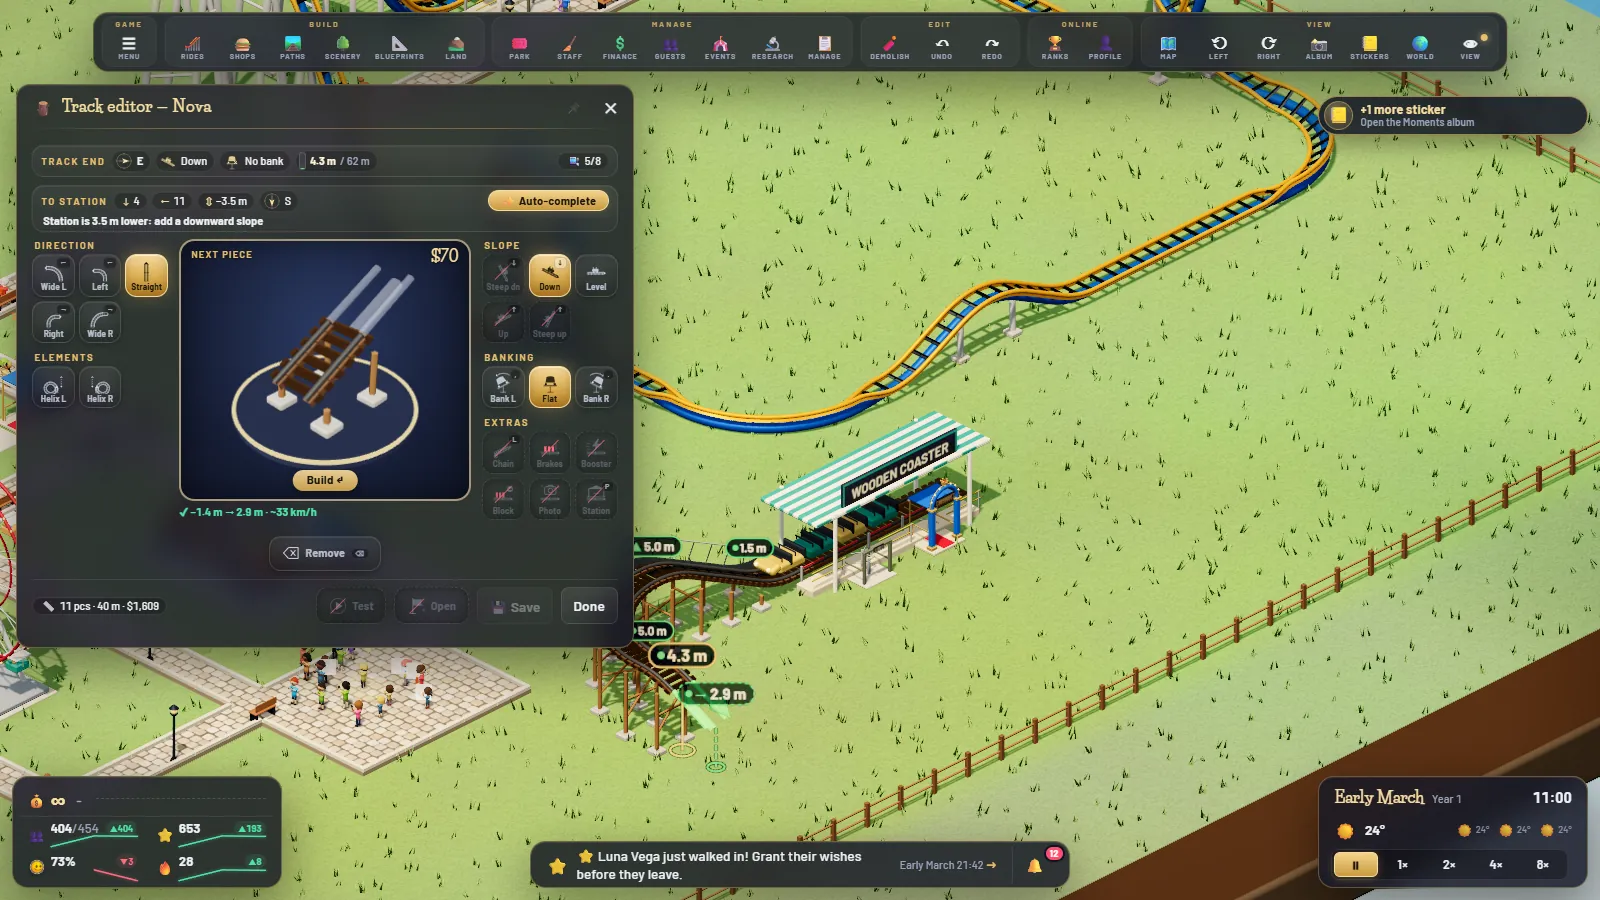
The coaster editor’s Graphs tab plots the speed, height and g-forces of every test run, and the ride window lists the maximum positive, negative and lateral g. The game reports a compressed “park g”, as the classic tycoon games did, so sensible designs land between 1 and 5 g; its ratings punish extreme values (see coaster ratings explained).