Calculator

Ride capacity and queue time calculator

A ride’s capacity decides how long its line gets. Enter how many seats leave the station at once, how long a ride lasts and how long loading takes: the calculator gives the riders per hour and the wait for the guest at the back of the queue.

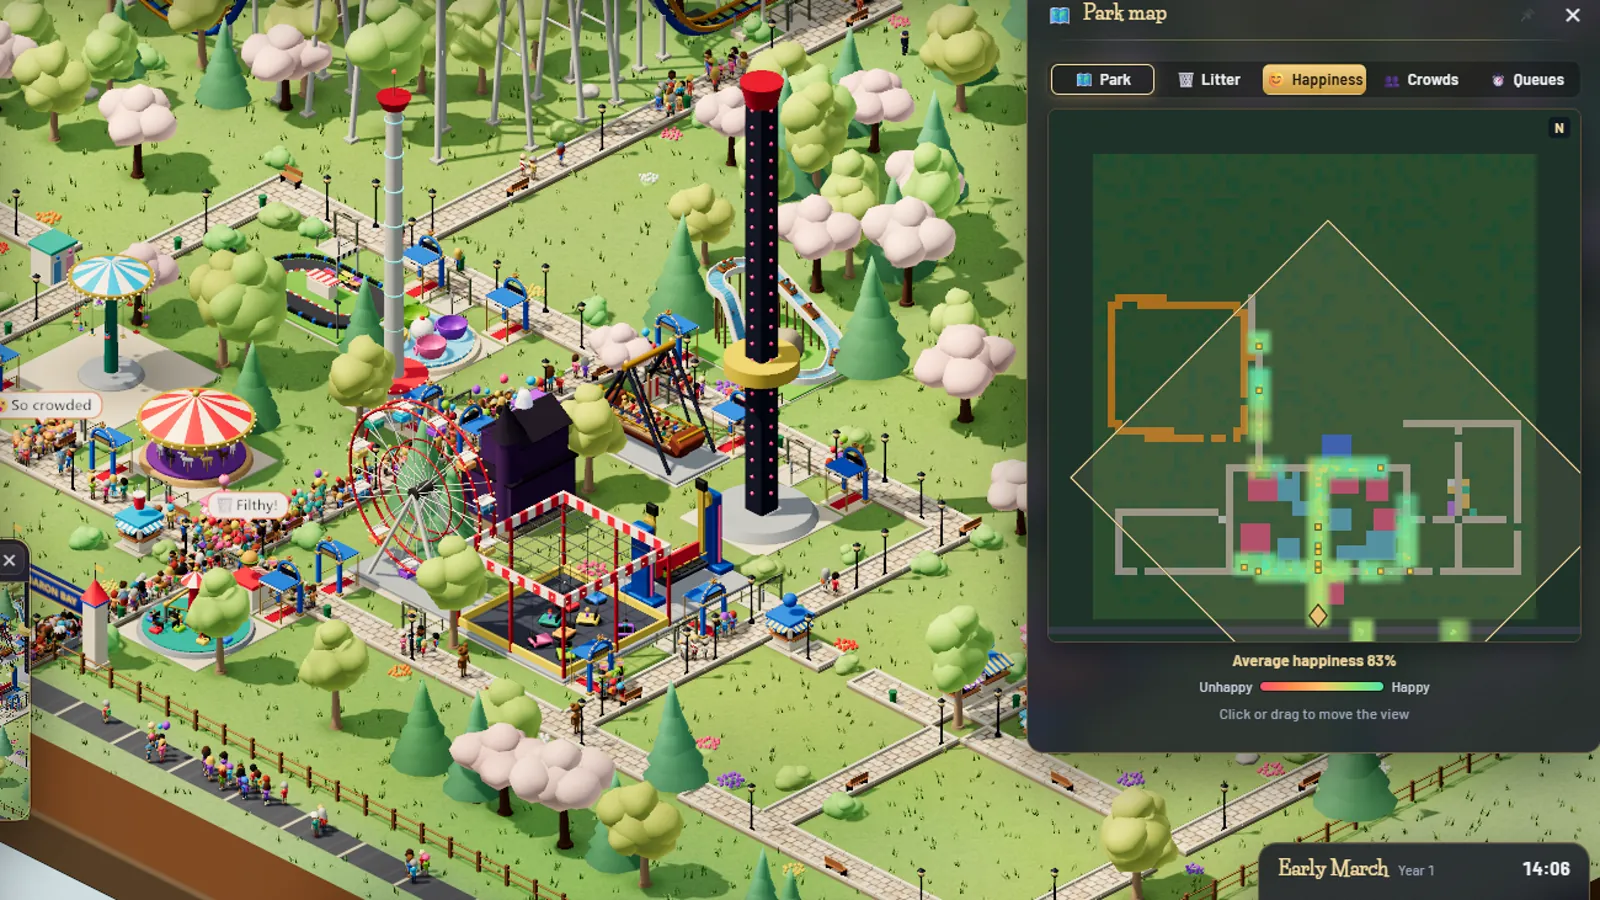
The Park Baron park map with its queue-time overlay beside the park

Your ride

A ride fills in its seats and its ride time as Park Baron defines them, with the game’s standard 4-second loading (the ride window’s Operate tab lets you set 4 to 30 s). The game runs on a compressed clock, so treat its times as a starting point and put in your own.

Result

Riders per hour
2,160
A departure every
40.0 s
Wait from the back of the queue
8.7 min

Park Baron’s rides compared

Theoretical riders per hour of every ride, one vehicle at a time, with 4-second loading: a full queue, and nobody waiting for a seat.

RideSeatsRide timeRiders per hour
Double-Decker Carousel2830 s2,965
Scrambler2428 s2,700
Gravitron2428 s2,700
Wave Swinger2432 s2,400
Spinning Teacups1622 s2,215
Enterprise2030 s2,118
Ferris Wheel2440 s1,964
Pirate Ship1630 s1,694
Magic Carpet1630 s1,694
Space Shot1222 s1,662
Frisbee1632 s1,600
Swing Ride1428 s1,575
Merry-Go-Round1224 s1,543
Star Flyer1634 s1,516
Drop Tower1020 s1,500
Tilt-A-Whirl1430 s1,482
Flying Elephants1226 s1,440
Mini Helicopters1226 s1,440
Kiddie Swings1024 s1,286
Hot-Air Balloon Race1230 s1,271
Splash Pad1645 s1,176
Spiral Slide822 s1,108
Aquarium Walk-Through1650 s1,067
Top Spin1030 s1,059
Mirror Maze1450 s933
Haunted House1245 s882
Mini Train1245 s882
Ghost Train1245 s882
Splash Boats1038 s857
3D Motion Simulator830 s847
Water Slide830 s847
Crooked House1040 s818
Observation Tower1250 s800
River Rapids1250 s800
Space Rings624 s771
Petting Zoo1255 s732
Bumper Cars840 s655
Log Flume840 s655
Mini Golf1060 s563
Swan Boats850 s533
Bumper Boats640 s491
Go-Karts645 s441
Slingshot218 s327

By Updated

Theoretical hourly capacity

The industry’s basic yardstick is the theoretical hourly ride capacity: how many people a ride could carry in an hour if the queue never ran dry and every seat were filled. One departure every (ride time + loading time) seconds, times the seats per departure: capacity = seats × 3600 / (ride time + loading).

A carousel with 12 seats, a 24-second ride and 4 seconds of loading carries 12 × 3600 / 28 ≈ 1,540 riders an hour. Real rides do worse (empty seats, a slow group, a restraint that won’t click), so parks plan with a lower operating capacity.

More trains, shorter waits

A coaster can run several trains at once, as long as block brakes keep them apart. The next train loads while the last one is out on the track, so departures come more often, but never faster than a train can be loaded: two trains on a 60-second circuit with 20 seconds of loading leave every 40 seconds, not every 30.

How long is the wait?

The guest joining the back of a queue waits for every departure ahead of them: the people in front, divided by the seats per departure, rounded up, times the time between departures. 300 people in front of a 24-seat ride that leaves every 40 seconds is 13 departures, a bit under 9 minutes.

How long a wait feels is another matter. David Maister’s classic 1985 essay on waiting lines argues that occupied time feels shorter than empty time, and that uncertain, unexplained and unfair waits feel longer than known, explained and fair ones: one reason parks theme their queues, show videos and post wait times.

In Park Baron

Every ride window has a Stations or Operate tab with its riders per hour and the wait for the current queue, previewed before you change a setting. Guests have patience: a line that barely moves makes them give up and leave unhappy, and queue TVs and entertainers make the wait feel shorter. Longer rides please guests up to a point but carry fewer riders an hour.

Sources

  1. D. H. Maister, “The Psychology of Waiting Lines” (1985)